Task 1: Data Collection
Searching by Focus Area
Two types of Satellite were used to search for suitable and clear (from clouds) satellite images. They are “Landsat 8” and “Sentinel 2”.
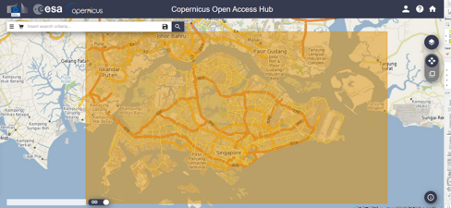
Focus Area for Sentinel 2 - Singapore
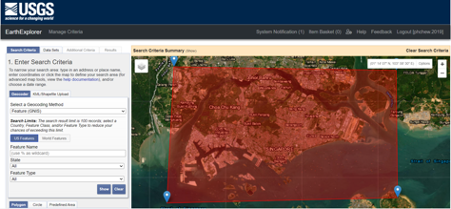
Focus Area for Landsat 8 - Singapore
Manual Evaluation of Satellitle Images
The goal is to select the satellite image with the least cloud for both study years 2020 and 2022. Initially when we used the filter function to get the images with cloud cover within 10 – 15%, we noticed that it is not as useful as the low percentage of cloud covered Singapore island for that image. Thus, we need to manually look through all the images (800+ Across both Satellite) to look for the best one possible. In addition, good images may be limited. Thus, we are less strict in terms of the study years. For Study 2020, we accept Satellite images in 2019 or 2020. For Study 2022, we will accept the end of 2021 or 2022.
Whenever we find ‘good’ satellite images, we will store them by their name given by the satellite to the Team’s Google Drive for choosing and comparing.
Landsat 8
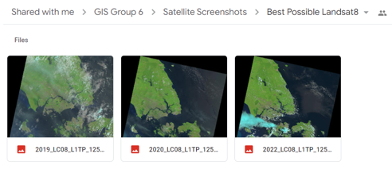
The best Satellite images for Landsat 8 found was 2 images which can be used for the study year 2020 (2019&2020) and only 1 image for study year 2022.
Sentinel-2
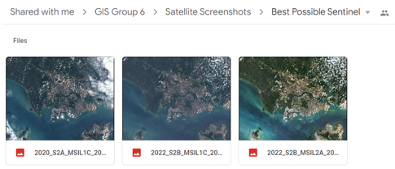
The best Satellite images for Sentinel-2 found was 1 image for 2020, and 2 images for 2022.
Comparison and Final Selection
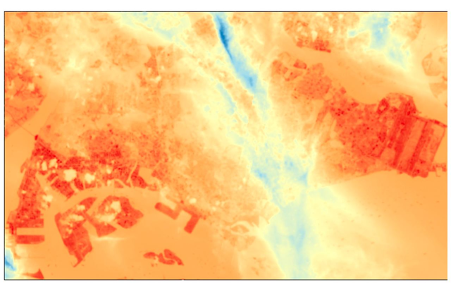
After comparing, the team decided to use Sentinel-2 Data. This is because although in the Landsat data where it looks clearer than Sentinel, there are translucent grey clouds covering the entire Singapore. Test (Thermal on Landsat) was done to confirm that those clouds exist despite looking like there is no cloud cover.
The test results (Landsat Thermal) showed that majority of Singapore was blocked by those translucent cloud.
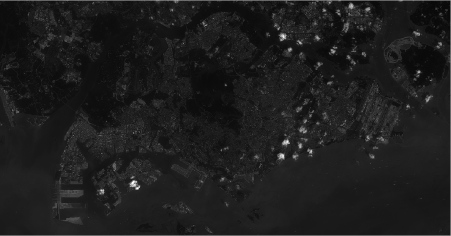
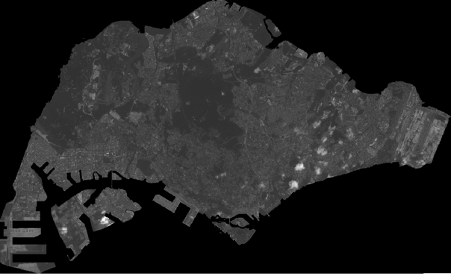
On the other hand, for Sentinel-2, although the cloud covers are thick and obvious, it does not have any translucent grey clouds covering Singapore. Majority of Singapore’s land is clear from clouds.
Therefore, the team decided to use Sentinel-2 data for Analysis of Land Cover changes and detection project and Landsat 8 for the LST.
Within Sentinel-2, there are 2 images to choose from for the study year 2022. After downloading both and using QGIS for closer observation, the darker one gives a clearer satellite image with lower cloud coverage.
Final Selection of Data:
Study Year 2020:
S2A_MSIL1C_20200126T032011_N0208_R118_T48NUG_20200126T061348
Study Year 2022:
S2B_MSIL1C_20220130T031949_N0400_R118_T48NUG_20220206T133433
Task 2: Data Preparation
As the preparation of both 2020 and 2022 are similar, the images and descriptions seen below will be from 1 study year.
Singapore Mainland Boundary
We are not interested in Malaysia or sister-islands like Pulau Tekong. Thus, we use a custom boundary of mainland Singapore to clip the Raster by masked extent to get Singapore mainland.
Before:
After:
Basic Visualisation (TCC, FCC, NDVI)
Using the SCP Tool, we define the Band Set using the Clipped Layer.
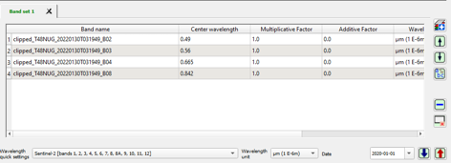
We then produce the TCC and FCC (Mainly used for visualisation) using the appropriate bands. These visualisations will help when selecting training data for the classification method.
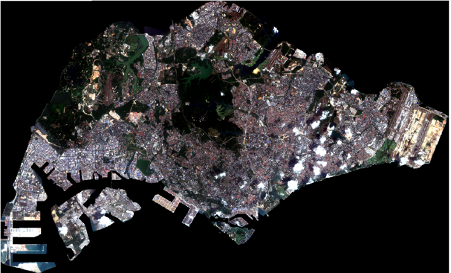
TCC (4-3-2):
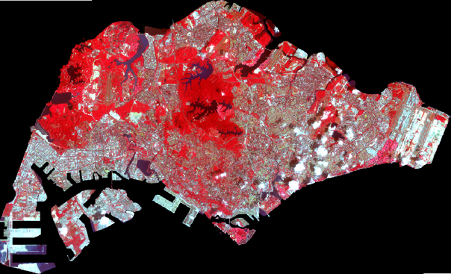
FCC (8-4-3):
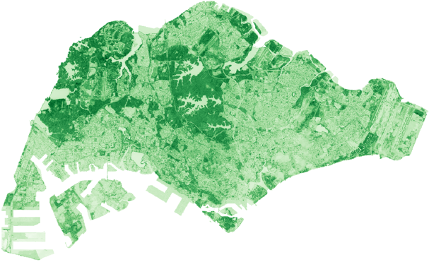
To achieve NDVI, we use Raster Calculator and plug in the formula to calculate NDVI for Sentinel-2:
NDVI = (NIR-RED) / (NIR+RED)
Then the final step is to change the symbology colors to shades of green to see the health of the vegetation index.
NDVI: